Google’s done it again, this time with their new Data Studio (currently in beta) which allows you to create dynamic, collaborative reports and visualization dashboards. Whether you’re on the enterprise cloud side looking for business intelligence, or an individual simply looking to create attractive dashboards to understand your data, the new Google Data Studio is something I highly recommend you check out.
Here’s a quick video introducing the 360 Suite (enterprise level):
So in short, with Data Studio, you can:
- Connect to an increasing variety of data sources ranging from Google Analytics, DoubleClick and AdWords, to YouTube Analytics.
- Create interactive reports and dynamic dashboards.
- Share and collaborate with your peers, similar to Google Drive.
In order to view/use the Data Studio, you must own and be signed into a Google account. Next, in order to create the actual reports, you must be signed into your account and able to use Google Drive, as this connector is crucial to storing/leveraging your analytics and data sources.
The Data Studio was first opened to the public back in late July / early August of 2016. The first thing you’ll see when entering the home dashboard page is something like this:
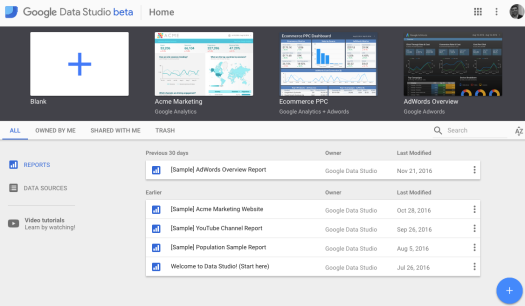
As you can tell, the Google Data Studio team, led by Nick Mihailovski, are consistently updating the experience with sample reports to touch on the various capabilities of the Studio, as well as rolling out video tutorial support, report tutorials and templates, and a “what’s new in Data Studio” webpage.
You may also want to check out the Data Studio Advertiser Community forum, housed under the Google Analytics Community forum. So many great resources to help you learn and leverage this new tool. 💪
Digging Deeper
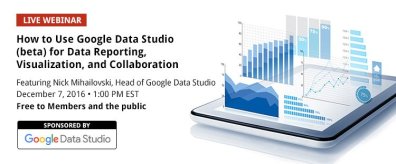
This week I sat in on a webinar hosted by the Digital Analytics Association (DAA) and sponsored by the Google Data Studio to learn more. You can view the webinar here.

Nick Mihailovski, the Lead Product Manager on Data Studio, led the live webinar. Kevin Fields, a Product Marketing Manager, was there to support. Nick, who has worked in Web Analytics for over 10 years, oversees data integrations, machine learning, interactive visualization, and mobile experiences.
This webinar was focused on illustrating how beginners can leverage the Data Studio in design reports, and shared helpful resources for veteran data analysts on the product. You can download the Data Studio briefing deck here.
Learning Objectives:
- Link data from multiple sources using Google Data Studio.
- Design reports and dashboards that allow their team to collaborate to transform data into impactful visualization.
- Leverage a library of templates to get up and running in a matter of minutes.
- Transform your raw data into metrics and dimensions to provide your business with the insights it needs.
Nick opened by explaining the notion that 84% of marketers don’t believe their data sources are well integrated. This is a major issue in the analytics industry!

He then explained that the goal of the Brand Studio is to make data sources more accessible and useful — focusing on insights as opposed to wrangling data. It’s a product for everyday business users that’s easy and intuitive to use, in turn allowing the users to ask questions of the data and insights, forcing them to become more sophisticated in their usage. The deeper you dig, the more you’ll find, and the more sophisticated of a analytics techie you’ll become. On the cloud-side, the 360 product is for more advanced modeling with much larger data sets, and introduces concepts like machine learning, etc. Here’s a chart showing the main differences in functionality between the two levels of access:

The product is ultimately offering a strategic and competitive advantage in the ways you’re able to share, collaborate, save time, and make better data-driven business decisions. With the amount of business data increasing exponentially, it’s crucial you’re able to take a step away from the gathering/data entry, and simply look at the trends.
The Data Studio is set up as two integrated tools – the Data Sources tool, and a Reporting tool. Additional Data Sources are being considered on a daily basis, and the Google team was adamant about receiving feedback on this functionality. Additionally, you’ll be able to source any 3rd party data from Google Sheets to your Data Studio reports.

Product Demo

Nick then took us through a quick demo of some Data Studio features. We began with a blank report and added a few data sets via Google Analytics. Nick mentioned that CSV uploading would be available in 2017 — something they’re currently working on. In managing the product and your Data Studio reports, the interface follows the Office productivity pattern – as seen in Google Docs – with the simple toolbar layout. All you have to do is add some sort of visualization mechanism to bring the data to life.
In our quick session, Nick added visualization components around date parameters and their associated user sessions, Geo map of countries by sessions, and top sources (I should mention this was all real, live data).

Once you’re done editing the data and wish to View or Share your report(s), you’ll simply click the Edit slider on the top right. This creates an interactive and collaborative audience overview in less than five minutes, and similar to Google Docs you can see collaborators as they open/close the Data Studio report:

Note: In this report above, Nick added a few additional fields and mentioned to be wary of data figures and ratios when adding additional sources. Often the axis values will throw off your graphs/charts, so that’s something to be aware of. Once you become more comfortable with Data Studio, you’re able to insert metric pickers that will update your values/visuals live and in real-time. The reports are set up in this way to allow report consumers that are viewing the visuals to answer any of their own questions simply by adjusting whichever variables they’d like to control. This optimizes the experience for the end reader, with the ability to adjust and filter the data you’re looking at right there in the report.
In sharing and collaborating — you’ll email a link to users just like in traditional Google Docs. They can join with either editing or viewing permissions, and different colors will be used to visualize each user’s activity. This way, you can compile reports as a team simultaneously, and then share to groups and folders of people. Very easy and organized collaboration.
Sample Reports
We then took a look at specific interfaces built for specific Google customers.
Check out this beautiful DoubleClick sales dashboard:
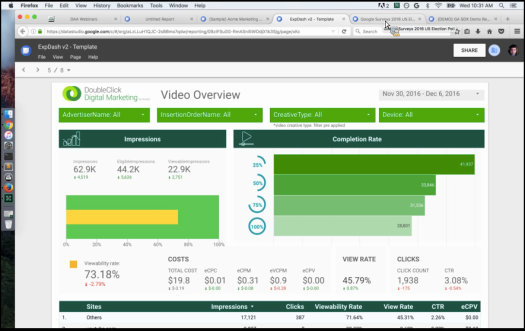
This report is actually eight pages, and includes an introduction/overview page on how to best leverage and consume the dashboard as well as a space for customer feedback.
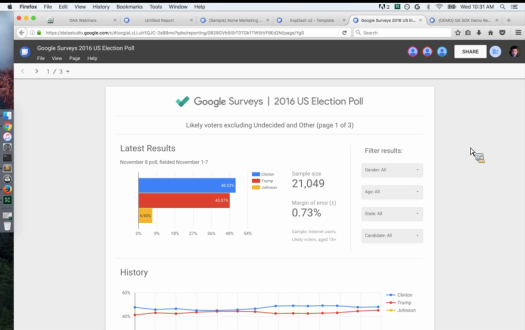
Another example is seen in the Google Consumer Survey Data report (below). This report focused specifically on the 2016 Election results, getting a ton of views from the public as there was a large demand to see what Google’s data is predicting. The interface is designed with everyone in mind, and allows you to answer your own questions in regards to demographics, ages, and locations.
A final report we reviewed was the Google Cloud Data Center report, dealing with insanely large amounts of data. As you can see below, we first looked at a report processing ~ 196M hits, followed by a report processing over 2.7 BILLION hits. The way the Data Studio was able to seamlessly plug in this massive amount of data was seriously impressive.

Again, this allows for the users to focus on the insights and presentation of data, as opposed to wrangling the analytics themselves. The concept was built around following Google’s simplicity and sharing model in their app ecosystem, then leveraging the power of the cloud and big data all meshed together. It’s no wonder the Studio, even in beta, is receiving praise from early adopters.
Templates
We briefly took a look at the templates currently available at the home page of the Data Studio. At this moment we’re seeing simple Google Analytics Marketing dashboards, Analytics + AdWords (PPC), YouTube Analytics, and Google Sheets integrations.

Expect this to be built out consistently, and perhaps crowdsourced similar to the Google Analytics Solutions Gallery (where contributors can import insights solutions and templates, searchable, and listed by popularity). Pretty awesome:

Q&A
The webinar ended with a brief question and answer… Here’s some takeaways:
- The Data Studio should be out of beta in Q1 of 2017.
- In Sharing, you can give “view-only” access, limiting impact some viewers will have on the reports.
- The Free product includes five reports, whereas the 360 Enterprise-level product is unlimited, and includes a Support Team and specific reseller channel for more customizable data.
- Nick, and his team, are working towards more blending of data sources — for example, the ability to simply drag/drop a merger of two charts. Data manipulation.
- The Data Studio team continues to invest in the concept of re-use, in other words the ability to increase efficiency and save time by plugging in previously created reports/charts.
For more information about Google Data Studio:
- Contact Us: Let Nick & Kevin know if you’re interested in Data Studio 360.
- Forum: Visit the active community forum that Google’s product team regularly monitors.
- Connector Requests: Help Google determine which 3P connectors they should prioritize.
This wraps up my overview of the Google Data Studio. Feel free to reach
out with any questions, or contact an enterprise sales rep to learn more!

Great article with great insights. In this line we’ve developed a Free Google Data Studio Template for Ecommerce. You just have to connect your own Google Data sources and start using it here: https://goo.gl/O04k38. What do you think?
Thanks for reading and commenting, Bruno. I’ll allow this redirect link for any readers interested in an eCommerce template! Cheers